The Operator’s Read
The DTC metrics that actually matter (and the one lying to you)
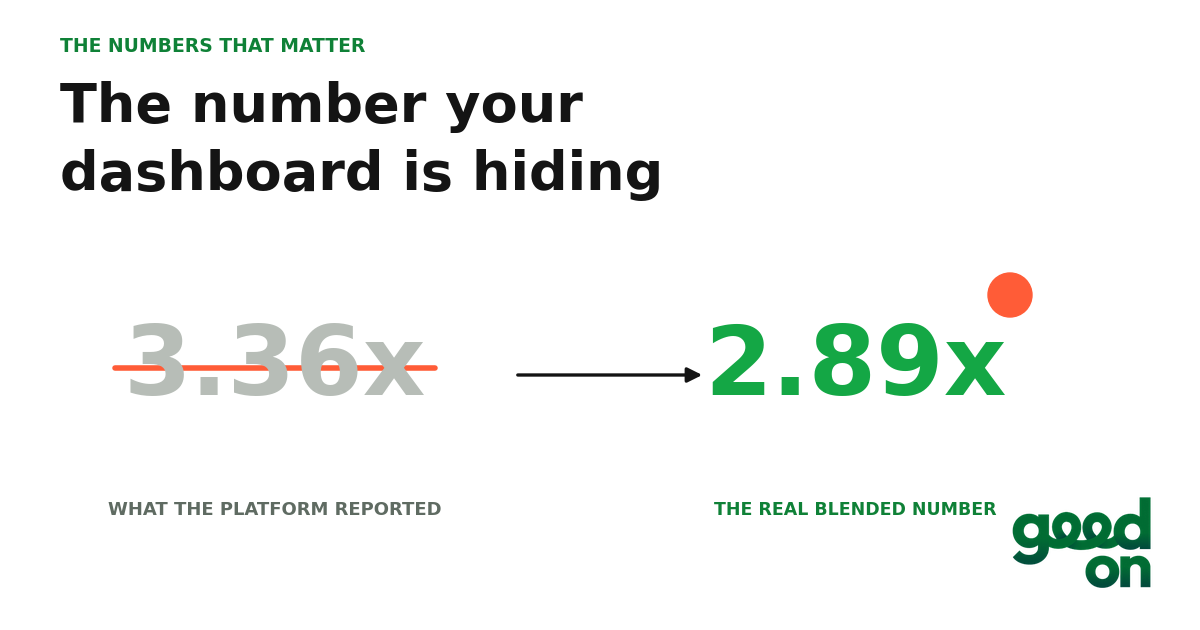
I once audited a brand that was certain it was running a 3.36 ROAS. Leadership was happy, the dashboards were green, everyone was ready to pour on more budget. Blended across every channel, the real number was 2.89, with a $70+ CPA and a 5.21 ad frequency. A frequency of 5.21 means you’ve stopped advertising and started stalking the customers you already had. The account wasn’t winning. It just looked like it was, because the team was reading the most confident liar in the business: platform-reported ROAS.
If you own growth at a $1M to $5M brand, the metric you trust decides the budget you set, and the story you tell your CEO. So here are the numbers that actually predict profit, the one that quietly lies, and how to report all of it upward so you look sharper, not shakier.
Why your ROAS dashboard lies
Platform-reported ROAS is revenue a channel claims it drove, divided by that channel’s spend. The problem is attribution overlap: Meta claims a sale, Google claims the same sale, your email tool claims it too. Add up the platforms and you’ve “sold” your product two or three times over. Reported ROAS also leans on view-through and modeled conversions, which flatter the number further. It’s a useful tactical signal for which ad is working today. It is a terrible number to run your business on, and a dangerous one to take to your CEO.
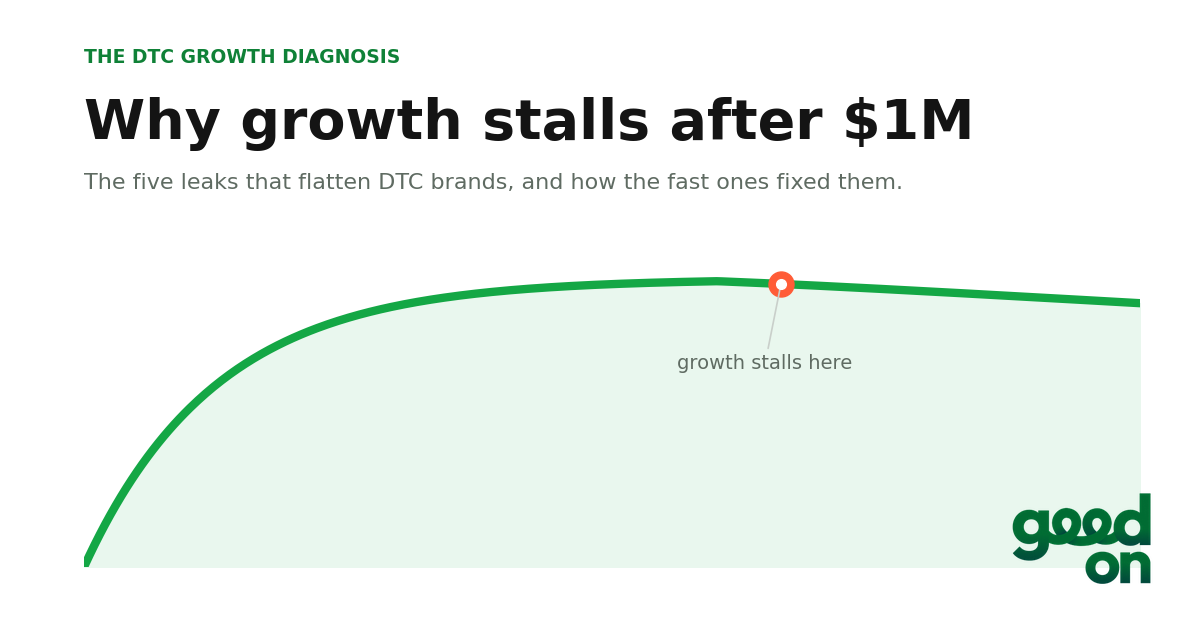
This is the same trap that stalls brands between $1M and $5M. If you want the full picture of how it hides the other leaks, we broke it down in why your DTC brand stalled after $1M.
The 5 numbers that actually matter
These are the metrics I’d want on one screen before I touched a budget. Save this table.
| Metric | What it is | Why it matters |
|---|---|---|
| Blended MER | Total revenue divided by total marketing spend (all channels, all revenue) | The true efficiency of your whole marketing engine. Can’t be double-counted. |
| Blended ROAS | Total revenue divided by total paid ad spend | A cleaner paid signal than platform ROAS, still excludes organic and email. |
| Blended CAC | Total acquisition spend divided by new customers | What a new customer actually costs across everything, not per platform. |
| Contribution margin after marketing | Gross profit per order minus the marketing cost to get it | The profit number. This is the one that pays salaries. |
| 12-month LTV | Average revenue (or margin) per customer over 12 months | The ceiling on what you can afford to pay for a customer. |
Save this. The single most useful pairing is blended CAC against 12-month LTV: it tells you whether you can afford to spend more, which is the question every scaling decision comes back to.
Get the operator’s read, monthly
The Good Word: what I’m seeing across $2M+ in DTC ad spend, in plain English, for growth leaders. No fluff, no pitch.
Subscribe to The Good WordWhat “good” looks like by stage
Treat these as directional, they move with your category and margins. These are the ranges we see across the DTC accounts we run, and they line up with public benchmarks: Common Thread Co puts a healthy DTC MER around 3x to 5x, higher for mature brands, against a breakeven MER of roughly 2x to 2.5x. The gap between your MER and your breakeven MER is your margin cushion, and it matters more than any industry average.
| Signal | $250K to $1M | $1M to $3M | $3M to $5M |
|---|---|---|---|
| Blended MER | 3.5 to 5x | 2.5 to 3.5x | 2 to 3x |
| Email & SMS % of revenue | 10 to 20% | 20 to 30% | 25 to 35% |
| Contribution margin after ad spend | 20%+ | 25%+ | 30%+ |
MER compresses as you scale, that’s physics, not failure. You’re buying colder, pricier customers as you grow. What should hold or rise is your margin after marketing and your owned-channel share.
Blended MER vs ROAS: when to use each
You need both, for different jobs. MER is the strategic number. It answers “is my whole marketing engine efficient and profitable?” and it’s the one to anchor budgets and board conversations on, because it captures the halo: the paid ad that drove an email signup that converted three weeks later. Blended ROAS is the daily tactical signal. It tells you whether paid is pulling its weight day to day. And platform ROAS (Meta’s or Google’s own number) is for optimizing inside a channel only, never for judging the business. To see any of this honestly, you need real cross-platform attribution, a tool like Triple Whale or Northbeam that reconciles every channel against Shopify, so the platforms stop marking their own homework. Good attribution also rests on clean, unified customer data, which is its own project, more on that in our guide to CDP platforms for ecommerce.
How to report this to your CEO
Here’s the part most measurement guides skip. Your CEO does not want a 40-tab dashboard. They want to know one thing: is marketing making money, and can we make more? Give them a one-page monthly read with four lines and you’ll look like the sharpest person in the building.
- Blended MER, with the trend. The headline efficiency number, and which way it’s moving.
- Contribution margin after marketing. The profit the engine actually produced this month.
- Blended CAC vs 12-month LTV. Proof you can afford to scale, or the reason you’re holding.
- One decision you’re making because of it. “MER held at 3.1x with margin up, so we’re increasing spend 15%.” That sentence is what leadership remembers.
Report the blended truth, not the platform number, and you never have to walk back a “we hit 4x ROAS” claim when the P&L doesn’t agree.
Want the full self-audit?
The free DTC Growth Audit Checklist covers exactly which numbers to pull and what healthy looks like, the same 12-point audit we run on client accounts before we touch a dollar of spend. Five minutes.
Get the free checklistIs your number lying? A 60-second check
Tick these against your own account. The more you can’t tick, the more your reported number is fiction.
- Do your platform ROAS numbers add up to more revenue than Shopify actually recorded? If yes, you’re double-counting.
- Can you state this week’s blended MER from memory? If not, you’re running on platform numbers.
- Do you know your contribution margin after marketing? If not, “profitable” is a guess.
- Is your prospecting frequency under about 3? Past 5 and you’re re-selling to existing customers while the dashboard calls it acquisition, a classic sign your Meta ads have stopped scaling.
- Do you have one source of truth reconciling channels to Shopify? If every tool reports its own number, none of them is right.
Where Good On fits
Good On is a boutique DTC performance-marketing agency: a small, senior team that plugs into whatever team you have and owns the hard parts. Honest measurement is where we start, because you can’t fix a number you can’t see. We install real cross-platform attribution, rebuild reporting around blended MER and contribution margin, and then scale against the truth. That’s how we took Orion from a 1.3x to a 6.5x ROAS, with peaks around 12x, and cut cost per sales-qualified lead for TAFC from $135 to $73.50. And we report in the metrics you take to your CEO, so the story upstairs is always one you can stand behind.
Not sure what your real numbers are?
Book a free 15-minute audit. We’ll pull your blended MER, CAC, and margin, name your top 3 budget leaks, and hand you a read you can take straight to leadership. No pitch.
Book your free auditFrequently asked questions
What is the difference between MER and ROAS?
MER (marketing efficiency ratio) is total revenue divided by total marketing spend, so it captures every channel and every sale. ROAS is revenue divided by ad spend, and platform-reported ROAS only counts the sales that channel claims, which overlaps with what other channels claim. Use MER to judge the business, ROAS to optimize a channel.
What is a good blended MER for a DTC brand?
Directionally, 3x to 5x is healthy for growth-stage DTC and can run higher for mature brands, against a breakeven MER of roughly 2x to 2.5x. But the right target depends entirely on your margins: benchmark against your own breakeven MER, not an industry average. MER also naturally compresses as you scale.
Why is my Meta ROAS higher than my real revenue suggests?
Because platforms mark their own homework. Meta, Google, and your email tool each claim credit for overlapping sales, and Meta leans on view-through and modeled conversions, so the reported number over-counts. Reconcile everything against Shopify with cross-platform attribution and judge the business on blended MER instead.
What is contribution margin after marketing?
It’s the gross profit on an order minus the marketing cost to acquire it. It’s the number that tells you whether growth is actually profitable, and it’s what you should report to leadership alongside MER. Revenue and ROAS can both look great while this one is negative.
What marketing metrics should I report to my CEO?
Four lines: blended MER with its trend, contribution margin after marketing, blended CAC against 12-month LTV, and the one decision you’re making because of those numbers. Skip the platform ROAS, it’s a tactical signal, not a leadership metric.